#4
NKE
Nike, Inc.
2X DCA
Buy Zone
Quality ✓Still falling
Snapshot at publication

See exactly when a stock is in a Buy Zone, and when to trim.
Standard: 7-day free trial · Cancel anytime before day 7.
See the backtest resultsHistorical backtest
Same money, same stocks. DCA Optimizer's timed buys vs investing the same amount every month.
Hypothetical simulations from the app's historical backtests. No fees, taxes or slippage. Past results don't predict future returns. Updated every weekday evening.
See it in 90 seconds
Quick (5 min) and full (28 min) platform walkthroughs with Ronnie V.
How it works
DCA means dollar-cost averaging: investing a set amount on a regular schedule, such as once a month, instead of trying to time a single entry. DCA Optimizer upgrades that habit by showing when conditions support buying more (2X–4X) or trimming.
Search supported stocks, ETFs and other available assets.
See its monthly zone, Free Cash Flow line and business badges on one chart.
Use verdicts, historical charts, backtests and scheduled alerts to support a more consistent process.
4X DCAExtreme Buy
The strongest accumulation category: up to four times your usual contribution.
3X DCAStrong Buy
Conditions support increasing contributions significantly above your normal DCA amount.
2X DCABuy
Conditions support increasing your recurring contribution above baseline.
1X DCAAdd
Conditions correspond to your normal DCA allocation.
TRIMLight Trim
Conditions suggest evaluating a modest reduction in exposure.
TRIMStrong Trim
The strongest indication to consider reducing exposure.
2X, 3X and 4X are multiples of your own baseline monthly contribution, not return predictions.
Decision support, not automated trading. You make every decision.
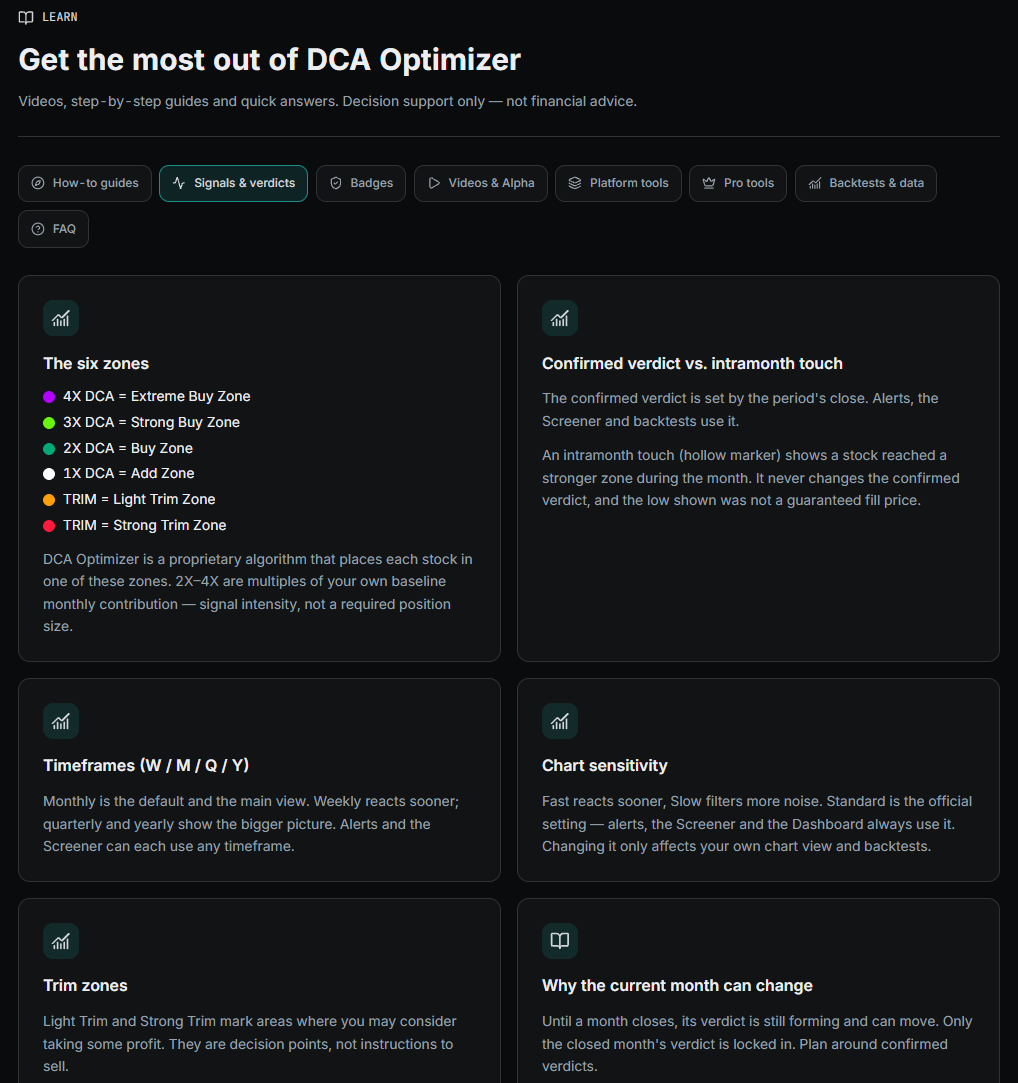
Videos, step-by-step guides and quick answers inside the app.
Start Free TrialThe platform
Discover opportunities, analyze historical signals, compare investments, and monitor the market with DCA Optimizer.
Included in Standard & Pro
NFLX · Frozen example · Oct 27, 2026
This company makes real cash and its debt looks manageable.
Cash flow or debt raise a red flag. Size positions carefully.
This company is bringing in more free cash flow than a year ago.
The drop looks like it's slowing down. Price may be finding a floor.
Price is still sliding. Spreading your buys out may make sense.
A buy zone that has not appeared recently in the available history.
Badges add context. They never change your DCA verdict. Frozen example, not a current signal.
DCA Alert Weekly, free every Monday
Membership
Start with Standard free for 7 days, or go Pro for full history and every tool.
Best for most users getting started.
$20/mo
Free for 7 days, then $20/mo · cancel anytime before day 7.
Full history, projected ranges and deeper tracking.
$30/mo
No trial · billed today · cancel anytime.
Everything in Standard, plus full history, advanced tools, portfolio tracking and much larger watchlist/alert limits.
Secure checkout · Cancel your Standard trial before day 7 and pay nothing · Manage billing from your Account page.
Educational only, not financial advice.
A quick look at Standard vs Pro.
Core Access
DCA verdicts (W/M/Q/Y)
Standard
Pro
Stock Screener & filters
Standard
Pro
Daily market closes
Standard
Pro
Quick (5 min) & full (28 min) walkthroughs
Standard
Pro
Charts & Backtests
Interactive Chart History
Standard
Pro
Historical Backtesting
Standard
Pro
Chart drawing tools
Standard
Pro
ETF zone comparisons
Standard
Pro
Multi-Chart (up to 6)
Standard
Pro
Research Tools
Companion badges
Standard
Pro
Analyst targets & estimates
Standard
Pro
DCA calculator & share cards
Standard
Pro
Sector & theme opportunities
Standard
Pro
Projected Ranges card & chart levels
Standard
Pro
Badge Screener filters
Standard
Pro
Smart Money Zones & Trim Zones
Standard
Pro
Anchored Volume Profile
Standard
Pro
Watchlist & Alerts
Watchlist
Standard
Pro
Ticker alerts
Standard
Pro
Badge context in alert emails
Standard
Pro
Watchlist ranking & share image
Standard
Pro
Portfolio Tools
Portfolio & position tracker
Standard
Pro
Allocation, cash & plan settings
Standard
Pro
FAQ
Short, honest answers.
New accounts can start Standard with a 7-day free trial. Pro has no trial. All sales are final after billing begins; cancel renewals anytime from your Account page.
Standard starts with a 7-day free trial. If you don't cancel, your first charge is at the end of the trial: $20/month or $200/year. Pro is charged when you subscribe: $30/month or $300/year. All sales are final once billing begins.
Both plans include companion badges and full available historical backtesting. Standard includes 36 months of Signal history and interactive chart history, 50 watchlist tickers and 6 ticker alerts. Pro adds full available history, 200 watchlist tickers and 200 ticker alerts, plus Projected Ranges, badge Screener filters, badge context in alert emails, Multi-Charts, Smart Money Tools, Anchored Volume Profile and the position tracker. Both use real finished daily closes. Available history varies by ticker.
Yes. Cancel your renewal anytime from your Account page. If you cancel during the Standard trial, you pay nothing, and your watchlist and settings stay saved if you come back. To change your plan or billing period, open manage billing from your Account page; Stripe's secure billing page shows the exact amount before you confirm.
No. Every stock shows one zone in plain words. The charts are there when you want more.
They are multiples of your own baseline monthly contribution. 2X is twice your usual amount, 3X three times, 4X four times. They are not predictions of returns, and higher multipliers don't guarantee success.
No. DCA Optimizer is decision-support software, not financial advice. You decide what to buy, hold or trim; it never executes trades or manages money.
No. They are hypothetical simulations on historical monthly prices, excluding fees, taxes and slippage. Either approach can come out ahead. Past results don't predict future results.
Every weekday evening after the market closes, using settled daily closes, not live quotes. Long-term buying doesn't need tick-by-tick prices; the close is what counts. Waiting for the settled close removes intraday noise and keeps decisions calm and disciplined. The current month is still forming and can change until it closes.
Badges add business and price context beside a verdict: cash flow and debt, weekly stabilization, growing free cash flow and unusual buy-zone history. Both plans can see available badges. Not every stock qualifies, and missing evidence is not a negative rating. Badges never change the verdict or predict a recovery.
A Pro-only card and optional chart levels showing conditional closing-price ranges for buy and trim zones. They are separate from analyst targets and confirmed verdicts. These ranges are not predictions, probabilities or promises that a price will be reached.
A stock can reach a stronger zone during the month and finish the month in a different one. Touches show those moments with hollow markers. They never change the confirmed monthly verdict, and the lows shown weren't guaranteed fill prices.
Start with Standard
Try Standard free for 7 days. You decide what to follow.
Standard: free for 7 days. Pro: $30/mo, no trial.
Based on the stocks.
#1
#2
#3
#4
Nike, Inc.
2X DCA
Buy Zone
Snapshot at publication
#5
Intel
2X DCA
Buy Zone
Snapshot at publication